

Why Europeans save differently — and how to put those savings to work
15 September 2026
By Andrei Dumitrescu, Zakaria Gati, Justus Meyer, Laura Parisi and Alessandro Spolaore
Around 80% of euro area households do not own stocks or any other market-based financial instruments, unlike their counterparts in the United States. This blog post examines the barriers that keep many Europeans from investing and explores ways to broaden capital market participation.
Euro area households hold substantial savings, yet around a third – nearly €10 trillion – remains concentrated in cash and low-yield bank deposits.[1] Meanwhile, 80% of households do not own stocks or any other market-based financial instruments.[2] Population survey data reveal a striking gap in capital market participation between euro area and US households. Perhaps even more strikingly, this gap widens when comparing wealthier households. Even well-off Europeans invest significantly less in capital markets than their US counterparts.[3]
This matters because household savings invested in capital markets can play an important role in financing innovation, productivity and long-term growth, helping to close the investment gap highlighted in the Draghi report.[4] Participating in capital markets can also help households achieve higher long-term returns, supporting wealth accumulation over time.
To understand why so much potential remains untapped, we look beyond the aggregate figures and identify four distinct household archetypes based on how they allocate their wealth. The results show that barriers to capital market investment vary significantly across households. Unlocking more of the euro area’s savings potential will require targeted policy measures, tailored to the different characteristics, preferences and constraints of households.
The investment gap between European and US households
Before we zoom in on euro area households, let’s compare capital market participation on both sides of the Atlantic. To get a clearer picture, we draw on the euro area Household Finance and Consumption Survey (HFCS) and the US Survey of Consumer Finances (SCF). Both surveys are based on many thousands of interviews, covering the financial situation of the participating families and individuals in detail.
When comparing euro area and US households, a striking gap emerges. First, euro area households hold an average of about one-third of their financial assets as bank deposits, offering little or no return. Meanwhile, US households hold only 11% of their financial assets as deposits (Chart 1a). Second, the gap between US and euro area investment habits varies across the wealth distribution. Among the least wealthy households this gap is relatively small: households on both sides of the Atlantic first build a rainy-day fund, leaving little left over to invest. However, the gap is much wider for wealthier households. Among the wealthiest 20% of households in the US, more than 65% hold listed shares, bonds or mutual funds, compared with less than 45% in the euro area (Chart 1b).
This suggests that the lower capital market participation of euro area households cannot be explained by affordability alone. Investment habits, product availability and differences in institutional structures (e.g. pension systems) also matter.
Chart 1
Portfolio composition and capital market participation rates
a) Portfolio composition of households and savings rates by jurisdiction |
b) Total wealth quintile analysis and capital market participation rates |
|---|---|
(left-hand scale: percentage of total; right-hand scale: percentage) |
(percentage of total) |
 |
 |
Sources: HFCS (Wave 2021), SCF (Wave 2022) and Eurostat
Notes: Panel a): population-weighted portfolio composition of euro area households as reported in the HFCS Wave 4 data. Financial assets (FA) include deposits (sight and saving accounts), bonds, listed shares, mutual funds, pensions & insurance (value of voluntary occupational pension plans and whole life insurance policies of household members), unlisted & other equity and loans (money owed to households). For the euro area, portfolio allocations derived from the HFCS were benchmarked against the corresponding composition in the national accounts, using the mapping provided in ECB Statistics Paper Series No. 37 to ensure consistency between the two data sources. For the US comparison, the SCF was used as the counterpart to the HFCS, with survey concepts and asset classifications aligned across the two datasets to ensure comparability. Panel b): pooled and weighted euro area population grouped into quintiles according to total wealth. Total wealth includes all of the financial assets detailed above, household main residence and other real estate. Bars show the average share of selected asset classes in household portfolios by quintile, while dots indicate the participation rate in capital markets within each group. Capital market participation refers to holdings of bonds, equities and mutual funds.
Four household archetypes can help explain this pattern
By tracking the detailed portfolio composition of individual households across euro area countries, the HFCS results can offer a much richer picture than mere aggregate figures.
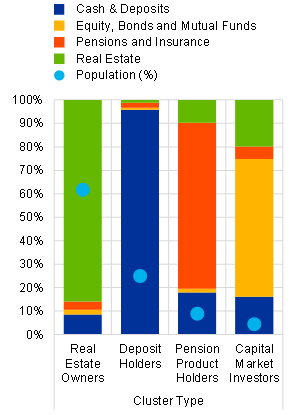
Cluster analysis is one way to analyse complex wealth data. This is a statistical method that groups households with similar financial profiles. Using this method, we can identify four distinct types of euro area households, each with a different approach to saving and investing (Chart 2a).
- Real estate owners: over 60% of euro area households hold the bulk of their wealth in the highly illiquid form of real estate, usually houses or apartments. This group includes both households who own their primary residence and those who use property as an investment.
- Deposit holders: around 25% of euro area households keep their savings predominantly in bank accounts, with minimal exposure to financial markets.
- Pension product holders: around 10% of euro area households participate indirectly in financial markets through occupational and voluntary pension and insurance products.
- Capital market investors: only a small minority (just 4%) of euro area households invest a sizeable share of their wealth directly in financial markets, through equities, fixed income instruments, mutual funds or ETFs.
These four groups highlight the extent to which euro area savings remain concentrated in assets other than market-based instruments.
Chart 2
Portfolio clustering analysis
a) What do households hold? |
b) Who holds these portfolios, by wealth quintile? |
c) Why do these households save? |
|---|---|---|
(percentage of total) |
(percentage of total) |
(percentage of households that answered “yes” to the saving motive) |
 |
 |
 |
Source: HFCS (Wave 2021)
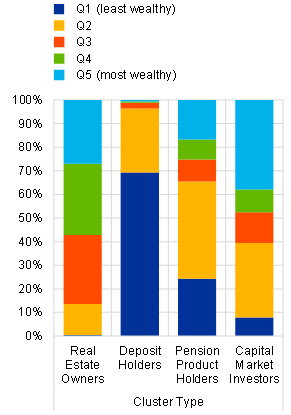
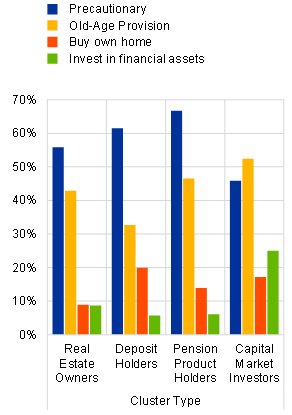
Notes: Panel a): results of K-Means clustering (four-cluster solution) using the asset-class weights of the population-weighted households. Clustering methodology per Oehler and Wanger (2020). The following asset-class weights were applied as separate cluster variables: real estate (household main residence and other real estate), cash & deposits (sight and savings accounts), pensions and insurance (voluntary occupational and life insurance) and equity, bonds and mutual funds. The chart shows the average size of each asset class in each cluster, together with the weighted population percentage represented by each cluster. Panel b): distribution of households by wealth quintile within each cluster, obtained by cross-tabulating the clusters in Chart 2a and the wealth quintiles in Chart 1b. The bars show the relative share of households from each wealth quintile within a given cluster. Panel c): distribution of saving motives by household cluster. Households with the means to save (i.e. with income exceeding their expenses over the previous twelve months at the time of completing the survey) were asked about their reasons for saving. The total may exceed 100% because multiple options were allowed. For comparability, the saving motives “education”, “bequests”, “other major expenses”, “paying off debts” and “setting up a business” are not shown.
Barriers to capital market participation differ…
Let’s explore households’ wealth profiles and saving motives in greater detail (Chart 2, panels b and c):
The “real estate owner” household archetype can be found across the wealth distribution. However, this archetype is more common among middle and higher-wealth households, reflecting the capital required to own property. This group saves primarily for precautionary reasons and old-age provision. However, property cannot easily be turned into cash, and households with much of their wealth tied up in real estate may struggle when unexpected expenses arise.
The “deposit holder” archetype is concentrated in the lower wealth quintiles. Their main reason for saving is to ensure they have money set aside for unforeseen expenses or emergency savings. For many lower-wealth households, limited financial resources appear to restrict their ability to participate in capital markets.
“Pension product holders” cluster in the middle of the wealth distribution. Their main saving motive is old-age provision, consistent with their indirect exposure to capital markets through pension and insurance products. In contrast, “capital market investors”– although a small minority – have a surprisingly diverse wealth profile. They also save mainly for old-age provision, reflecting the longer investment horizons often associated with direct market participation.
Indeed, complementary evidence from the ECB’s Consumer Expectations Survey, as presented in a recent ECB Working Paper, shows that limited equity market participation reflects more than just financial constraints.[5] For households that are not financially constrained, perceived risk is the main barrier to investing in stocks or equity-based mutual funds. Limited knowledge and low trust in financial markets also deter many households from investing. This is why households’ perceptions and financial literacy play an important role (Chart 3). Indeed, the evidence may actually underestimate the relevance of financial literacy, as limited understanding can itself contribute to low trust in financial products and heightened perceptions of risk.
Chart 3
Reasons for not investing in equity
(percentage of total)

Sources: ECB Consumer Expectations Survey (CES) and authors’ calculations.
Notes: Population-weighted data from the November 2023 experimental topical module on consumer finances, covering Belgium, Germany, Ireland, Greece, Spain, France, Italy, the Netherlands, Austria, Portugal and Finland. Non-investors were asked: “What are the main reasons why you and your household are currently not investing in stocks or mutual fund shares?”
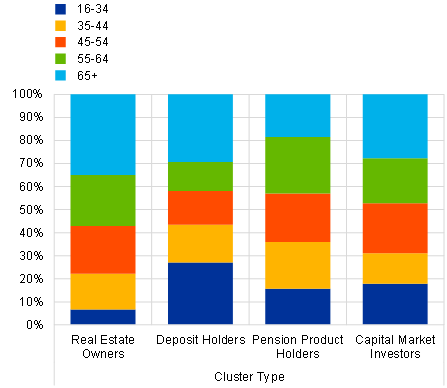
Why do investment patterns differ so much across households? Several factors are at play. The institutional context – including tax incentives, pension structures and the availability of simple investment products – can shape households’ investment choices. Trust in markets, financial literacy and education levels can also influence whether households feel ready to invest (Chart 4, panel a). Age plays a role too, with older households tending to invest in property, while younger households spread their savings across cash and saving accounts, pensions and capital market products (Chart 4, panel b). These drivers do not act uniformly, and no single policy measure can promote capital market investment across all households.
Chart 4
Additional household characteristics by cluster
a) Education groups by cluster |
b) Age groups by cluster |
|---|---|
(percentage of total) |
(percentage of total) |
 |
 |
Source: HFCS (Wave 2021)
Notes: Panel a): distribution of the education level of the most knowledgeable person in the household within each cluster presented in Chart 2a. Panel b): distribution of the age group of the most knowledgeable person in the household within each cluster presented in Chart 2a.
… and so must the policy response.
Better access to capital markets can help households earn higher returns and diversify their investments. We need a combination of measures to address the specific limitations faced by different household groups. Several successful initiatives from across the euro area can point the way forward.
Enhancing financial literacy across the EU, building on initiatives already undertaken by the European Commission,[6] could help households improve their understanding of financial products and better assess the risks involved.[7] Launched in 2010, Slovenia’s National Financial Education Programme has helped the country achieve some of the highest financial literacy scores in the EU. Meanwhile, offering simple and accessible investment products can help improve transparency and build trust in capital markets. In Finland, for example, equity investment accounts have encouraged greater engagement with capital markets. At the end of 2024, 37% of the country’s households owned mutual funds, listed shares or both. Finally, thanks to mandatory occupational pension schemes, households in the Netherlands can benefit from capital market returns without the need to make active investment decisions, supporting long-term wealth accumulation for households with limited time or financial resources.
To be effective, an EU-wide strategy needs to do more than make capital market products easier to access and more transparent. It must also address knowledge gaps, low levels of trust and concerns about investment risk. Its success will depend on creating accessible ways to invest that reflect the diverse demographics, financial situations, saving goals, ages and education levels of euro area households.
The savings and investments union agenda will play a critical role in scaling up such efforts. Key initiatives already on the table now require timely implementation. Swift progress on savings and investment accounts (SIAs) and on pension reforms[8] will be essential to channel Europe’s savings towards capital markets, providing the investment needed to support innovation, productivity and long-term economic growth.
The views expressed in each blog entry are those of the author(s) and do not necessarily represent the views of the European Central Bank and the Eurosystem.
Check out The ECB Blog and subscribe for future posts.
For topics relating to banking supervision, why not have a look at The Supervision Blog?
Legal Disclaimer:
EIN Presswire provides this news content "as is" without warranty of any kind. We do not accept any responsibility or liability for the accuracy, content, images, videos, licenses, completeness, legality, or reliability of the information contained in this article. If you have any complaints or copyright issues related to this article, kindly contact the author above.
